
I’m sure we all at some point wondered about the biggest quality issue our company has. If you are working in a multinational company with production operations in more than 2-3 countries, streamlining multiple sources of data and arriving to a meaningful conclusion to some of the deep rooted process issues is a challenging task. However with the use of business intelligence tools, the management and the workforce will be equipped useful information & real time dashboards, helping them focus on vital few issues than trivial many.
Over the years, I have noticed that the quality metrics are reported on a static format in a presentation i.e., capture quality metrics (DPPM, NCR’s, Corrective Actions, MRB inventory levels, PPAP’s) and present it to top management on weekly, monthly, quarterly basis. Although these metrics would indicate the overall trend in quality performance, top management would not have the flexibility to drill down on the most frequent issue. With the use of Business analytics tools, you will be able to visualize deep level data in real-time. For example:
- What is the most frequent defect type of the entire organization?
- Which supplier is causing this most frequent defect?
- Which customer is affected because of this most frequent defect?
- How much in dollar amount the organization is losing due to this defect?
- Which customer is affected because of this most frequent defect?
- Which supplier is causing this most frequent defect?
This is just a sample of what you can visualize instantly. This tool also serves in taking preventive actions – You will be able to predict trends (linear or logarithmic) based on the past quality incidents, notify team members when the actual data is exceeding the trend and take appropriate measures. I would like to walk you through the entire project I have conceptualized, initiated and executed successfully at one of the organizations I worked.
My Motivation
Throughout my experience as Quality Engineer, I have been reporting quality issues and capturing non conformance (8D) details in spreadsheets, SharePoint and SAP. Collaborative spreadsheets are great however, the feasibility of visualizing the data decreases when the data exceeds 1-2 years. My biggest challenge being a quality engineer was – I was not able to visualize historical data such as:
- What is the biggest issue our company has?
- Which one of the company’s product family is most affected because of supplier quality issues?
- Which supplier is responsible for highest cost of poor quality?
I had prior learning experience in Business Analytics that helped me evaluate various data sources that a Quality Engineer has access to. After realizing the opportunities, I have initiated the project on PDCA (Plan-Do-Check-Act) approach
Plan
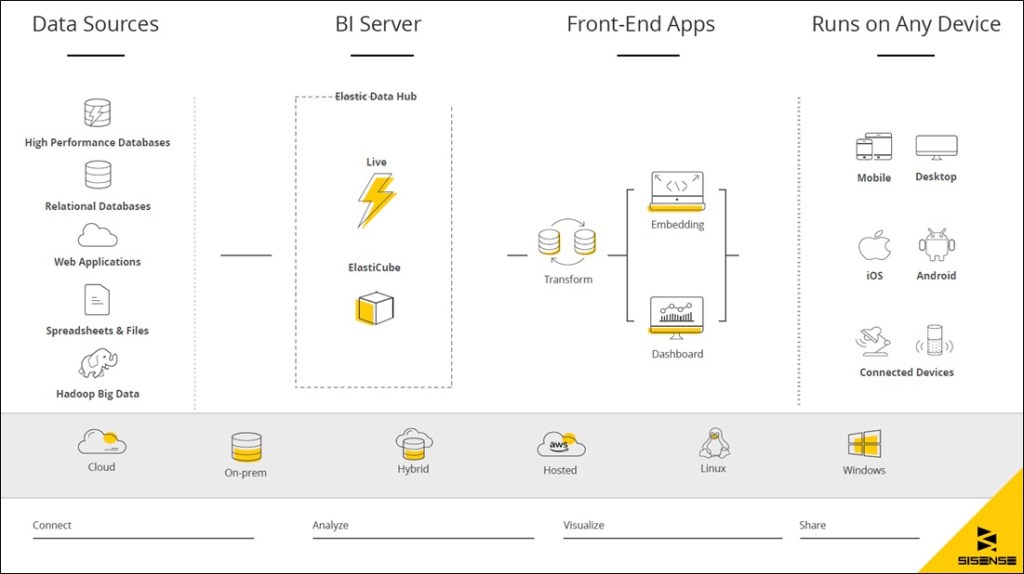
This was a crucial stage in the project. Most of the business analytics softwares like Microsoft Power BI, Tableau or Sisense etc. can connect to various data files like csv, excel, xml, google analytics and many other data sheets. Alternatively, they can be connected to live web based data sources like Microsoft SQL server, mySQL, SharePoint etc. The advantages of connecting to web based data source is it takes little to no manual effort in updating the dashboard. The metrics on business analytics dashboard are updated as the users enters information on to the web portal.
Phase 1 : My biggest challenge was to transform the data stored in excel sheets to web based mySQL portal. In order to achieve this, I collaborated with IT engineers and built a portal where SQE’s would enter non conformance quality details. My next step is to eliminate or add any other columns that we have been unable to collect. For example: When a supplier quality engineer is opening a quality issue with supplier in the portal, they may not see a specific defect in the drop down menu. So they tend to choose “Other defect” by default. However, over the course of an year or two, this “Other defect” has contributed to 30% of our overall defects. We have thus failed to capture an important detail over the years.
Do
I have divided “Do” phase into 2 phases. Phase 1 was simple – Eliminate “others” as an option from all drop down menu of Quality Portal. An QE/SQE must report what defect was found, which specific product family was updated and how the non conforming parts are disposed. Although there was some resistance at first, I was able to convince multi location teams on this initiative.
Once the web portal is updated, it’s now time to connect to a AI-driven business intelligence software (There are several technical details that are involved in executing this step but this would be discussed in later discussions). The database I have connected to was mySQL and the setup was pretty much straightforward. I have then established several important relationships between the information that Engineers inputs. For example: I would like to know how many quality incidents ( based on commodity) occurred throughout the organization (all over North America) and how many of them were repeatable issues. In order to enhance this information, I have implemented Pareto chart that helped me identify what repeatable issues are contributing to 80% of our quality issues.
Here’s the exciting part – I also have an option to drill down the information further. Do you want to know which product family has most repeatable issues? Sure. Would you like to know which part number or part description is contributing to highest customer complaints? No problem. All this information is available at your fingertips.
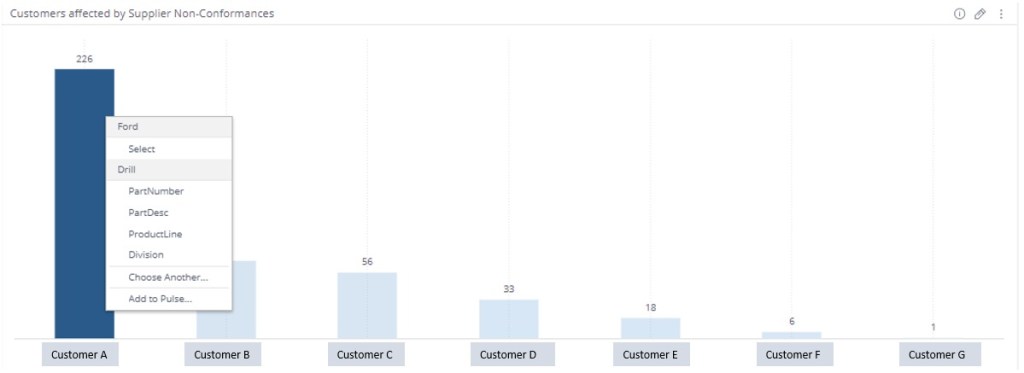
Figure 2.1 – Drill into 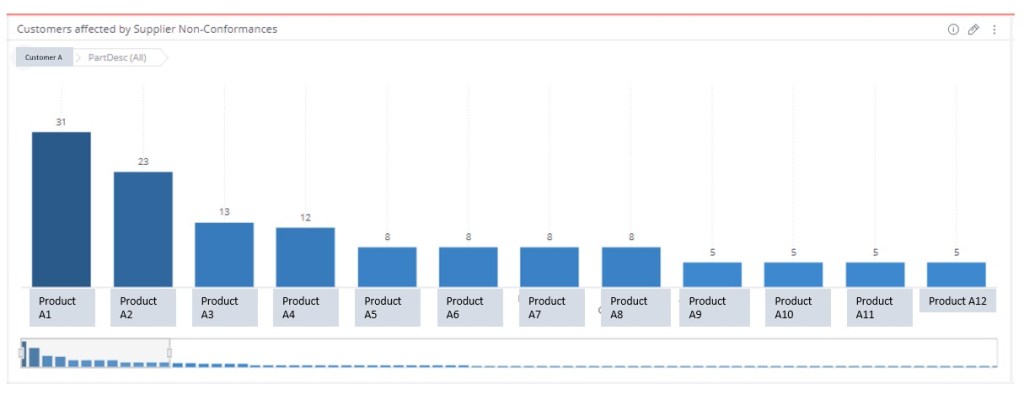
Figure 2.2 – Part desciptions of customer A affected by poor supplier quality
You could also create a trend line that predicts the future quality incident trend based on historical data. Do not worry about outliers data. The AI-assisting tool can help minimize the impact of outliers on the trend.
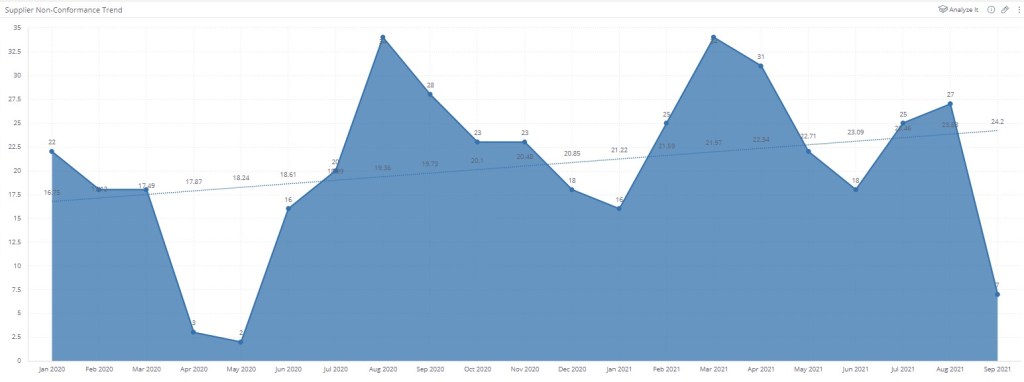
Its very important to be proactive and avoid quality issues before they occur. Users will have an ability to get alerts if the quality trend for a customer is taking a upward trend. Most of the companies wait until quarterly scorecards to take action. However, this approach would help organizations to detect patterns and take preliminary actions and avoid major quality issues and potential supply chain problems.
So far the progress has been phenomenal. I am now equipped with all the information that can help me answer 2 out of the 3 questions I have discussed in “My Motivation” section. The next step – and a very important step for the organization – is integrating cost of poor quality. Although the number of non-conformance incidents might provide useful information, It is very important to know what non-conformance is causing biggest loss in terms of cost of poor quality. This will form a basis for continuous quality improvement initiates for the organization. I will be discussing Phase 2 of the “Do” stage in next my next blog.
Stay Tuned!
